
March 2025
By Kelly Asche, Senior Researcher & Marnie Werner, Vice President of Research & Operations
Click here for a printable version of the report.
It seems that Minnesota’s regions continue to pit themselves against each other when discussing population growth—specifically, population migration and workforce development—but discussions usually lead to confusing and contradictory statements. People in urban regions say that all the young people leave rural areas to go to metropolitan ones, yet a minute later will talk about how everyone is fleeing the metro because of crime. In rural counties, the narrative may be that everyone is migrating out of rural areas, yet in the same breath we talk about a statewide housing shortage that’s keeping people from moving to rural counties.
Despite the amount of energy we spend talking about migration, though, the truth is that the number of people moving into and out of our regions hasn’t been the main driver of our change in population since the early 1900s. The largest contributor has been the number of births. Unfortunately, though, we are now facing a harsh reality: as the earliest Baby Boomers start turning 80 in 2026, the data are showing that the death rate is already having a significant impact on population trends because birth rates are no longer keeping pace.
Therefore, we’re back to migration as the only practical lever to pull in the battle to maintain population and relieve the workforce shortage. If we want to fill the state’s workforce needs in everything from home construction to hospitals and skilled nursing facilities, moving forward, we will have to make migration the prominent player in state policy around population growth.
The Minnesota State Demographic Center’s report, “An Analysis of Migration Trends and Patterns in Minnesota,” lays it out clearly:
[T]he importance of migration is growing as birthrates fall and the state’s population ages…. By the late 2040s any population growth that the state experiences will be due to migration rather than natural growth (the balance of births minus deaths).[1]
As a state, though, Minnesota does not perform well regarding migration. The same report points out that “[f]or the past 20 years, Minnesota has consistently lost residents on net to other U.S. states.”[2]
This doesn’t mean we can’t do better. Improving Minnesota’s migration numbers will take a state-wide effort, and more importantly, it will take a deeper understanding of the patterns within Minnesota. Fortunately, Minnesota has two organizations actively researching these migration trends, as well as the push-and-pull factors that drive the flow of people: University of Minnesota Extension’s Community Development[3] and the Minnesota State Demographic Center.[4] This report draws on their research and expertise to paint a picture of how rural and metropolitan areas in Minnesota have a role to play in efforts to retain and attract residents.
Minnesota’s many regions
To understand migration in Minnesota, we need to go deeper than statewide migration trends; they’re mostly a reflection of our metropolitan areas. Below the state level is a nuanced and harmonious flow of people making choices about where to live based on their stage and situation in life.
Minnesota’s regions, with their diversity of economies, amenities, and lifestyles, are a tremendous asset that many other states in the “Frost Belt” don’t have. Using this to bolster positive migration trends while also working to minimize the negative trends can ease our workforce shortages across the entire state.
To do so, we need to understand how each region provides a lifestyle that works best for households given their stages in life. Younger movers often prefer metropolitan areas and college towns, while the 30- to 49-year-old movers tend to prefer the suburbs and rural living. As people approach retirement, they may leave the state for warmer climates or stay in the state but move to areas rich with natural amenities. Finding ways to promote these assets to those age groups living inside and outside of Minnesota can help retain and attract people here.
There are a variety of ways to divide the state into subregions: planning regions and economic development regions are two examples. However, looking at the components of population change by region has the same inherent problem as looking at population at the state level: the trends happening in the population/economic centers tend to overshadow nearby communities. To get a better understanding of the components that fit together to make population change, it can be more helpful to look at these trends based on “ruralness” and “urban-ness.”
For this report, we’ll be using our RUCA Code method of grouping counties into categories of entirely rural, town/rural mix counties, urban/town/rural mix counties, and entirely urban. (A more detailed explanation can be found in Appendix A at the end of this report.) These codes use population density, urbanization, and daily commuting patterns to determine which group each county belongs to (Figure 1a and 1b).
Figure 1a: Most counties in Minnesota are somewhere in between the entirely rural and entirely urban groups. Data: Minnesota State Demographic Center – “Greater MN: Refined and Revisited”
Figure 1b: The number of counties in each category varies quite a bit. Data: Minnesota State Demographic Center – “Greater MN: Refined and Revisited
It’s well documented that there is a relationship between the population-change patterns of a county and how rural that county is. The population patterns of counties in each group all share similar characteristics.[5]
On reviewing the academic research on migration trends, however, we found that we needed to add an additional descriptor: whether a county is recreational or not, something that was added at the federal level as well.[6] The designation of “recreational” depends on three characteristics:
- Percentage of wage and salary employment based in the entertainment and recreation, accommodations, eating and drinking places, and real estate sectors as a percentage of all employment (Bureau of Economic Analysis);
- Percentage of total personal income reported for these same categories (Bureau of Economic Analysis); and
- Percentage of vacant housing units intended for seasonal or occasional use (2010 Census).
Two last refinements we then made were to take into account the similarities between Greater Minnesota’s entirely urban counties and Twin Cities’ suburban counties by combining them into one group, and recognizing the unique population trends in Hennepin & Ramsey counties compared to the rest of the state. So, now the county groupings look like this (Figure 2a & 2b):
Figure 2a: Minnesota’s six county groups, showing the categories where the counties had the most similarities in their population trends. Data: Minnesota State Demographic Center, “Greater Minnesota Refined and Revisited” | USDA ERS, “County Typology”
Figure 2b: Population trends and their components of change tend to follow similar patterns in these groups. Data: MN State Demographic Center & USDA Economic Research Services
Population change: From growth to plateau
The narrative that has surrounded rural and urban places for decades basically says that all metropolitan regions are growing in population and all rural areas are declining. But Minnesota is quite diverse, not only in its geography but also in age, race/ethnicity, and economy, which all lead to varying population growth patterns.
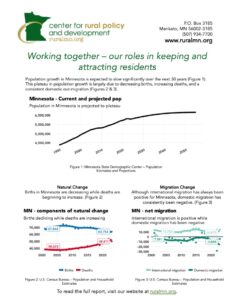
Minnesota’s population grew by 1.4 million people (33%) between 1990 and 2023, but it hasn’t been consistent growth. Minnesota’s growth rate was higher from 1990 to about 2005, during which it grew by 19%. From 2005 to 2020, though, it only grew by 9%, indicating that overall, the state’s population growth is slowing (Figure 3).
Figure 3: The Minnesota population has increased by 1.4 million people since 1990. Data: Minnesota State Demographic Center, Population Estimates
Figure 4 shows the change in population from 1990 to present, then projected out to 2055 in our six categories. Up to 2023, growth occurred in all county categories except for entirely rural counties (-18%). The largest growth occurred in the suburban and entirely urban counties in Greater Minnesota with growth of 73%, followed by rural recreational counties at 28% and the urban/town/rural county mix group at 25%. The projections currently indicate that there will continue to be stable growth in our suburban and entirely urban counties in Greater Minnesota, our rural recreational counties, and in our urban/town/rural mix counties. However, population growth in Hennepin, Ramsey, town/rural mix and entirely rural counties are expected to not grow at all or experience significant declines.
Figure 4: Population growth in Minnesota has occurred not just in suburban counties, but also in rural recreational counties, and they are projected to continue to grow. Data: Minnesota State Demographic Center, Population Estimates
Figure 5 shows that at a county level, a majority of counties, 58 of the 87 counties, have higher populations today than in 1990. However, by 2055 it is projected that only 49 counties will be in that same boat. The counties expected to experience the largest growth are the Twin Cities’ suburban counties, Central Lakes counties, and those along the I-94 corridor and the I-35 corridor.
Figure 5: Population growth will continue in the suburbs, along the I-94 corridor, the Central Lakes counties, and along the I-35 corridor. Data: MN State Demographic Center, Population Estimates and Projections
Components of population change, from births to deaths and migration
Negative natural change and net migration
What’s driving these trends? Declining births and increasing deaths are the primary factors. However, migration trends differ significantly depending on a region’s rurality, urban-ness, and/or amenities, and these differences can help policy makers understand how we can work together to benefit the entire state.
It’s important to understand that population change is quite dynamic, and it’s determined by two components, natural change and net migration.
Natural change = births – deaths
+
Net migration = (people moving in) – (people moving out)
Figure 6 shows the trend lines for each of these components in Minnesota since 2000. Historically, natural change played the major role in Minnesota’s population growth, adding over 30,000 people on average each year to the population during the 2000s. Net migration, on the other hand, contributed at most an average of 9,000 people annually and decreased population in counties with negative net migration by close to 5,000.
Beginning in the 2010s, however, natural change’s positive influence on population started fading—the 2023 population estimates reported that it contributed only around 14,000 people to the overall population, due to sinking birth rates and death rates that were rising even before the pandemic.
Migration, on the other hand, has been on a roller coaster, with strong net in-migration after 2012, followed by heavy net out-migration during and immediately after the pandemic; it’s important to note though, that 2023 estimates indicate that net migration rebounded, adding nearly 10,000 people that year. This is good news and we will have to wait to see if the turnaround is sustained.
Figure 6: Since about 2015, natural change and net migration have trended increasingly closer. Data: U.S. Census Bureau, Population and Household Estimates
Figure 7 shows the impact of the combination of decreasing births and increasing deaths: statewide, births peaked in 2007 at 74,405 and declined since then to around 64,000 in 2023. Deaths, on the other hand, have steadily increased since its lowest point in 2006 at 36,511 to nearly 49,911 in 2023.
Figure 7: Statewide, births are decreasing while deaths are increasing, reducing the large influence natural change has had on population growth. Data: U.S. Census Bureau, Population and Household Estimates
Migration, on the other hand, has a history of steady and positive net in-migration of international individuals and a volatile and largely net out-migration of domestic individuals (people already living in the U.S.). Figure 8 shows that international migration has consistently increased the population between 10,000 and 15,000 individuals annually since 2000 while domestic migration has consistently decreased the population between 1,000 and 10,000 individuals over the same time period.
Figure 8: Minnesota has had a consistent net in-migration of international individuals and a consistent net out-migration of domestic individuals. Data: U.S. Census Bureau, Population and Household Estimates
Putting this all together, we can see that the increasing death rates and the consistent net domestic out-migration are canceling out any gains from births and net international in-migration.
Natural change: deaths > births = lower population
+
Net migration: (people moving out) > (people moving in) = lower population
Another way to measure the impact of population change is by counting every change in population as a unit. For example, if there were 100 births and 150 deaths, the net population change would be -50 (100 births – 150 deaths). However, if we count each individual as a unit, there were actually 250 units of population change (+ ). This means that deaths contributed 60% of the change in population units. This is compared to the 40% that births contributed to the total population unit change.
Figure 9 shows that in 2000, births accounted for 54% of Minnesota’s total population change, while deaths accounted for 27.5%; domestic migration, 7.7%; and international migration, 10.9%. By 2023, however, births’ contribution had dropped to 48%, while deaths accounted for 38% of population change, and migration stayed significantly less.
Figure 9: Births are becoming less influential in Minnesota’s population change while deaths are playing an increasingly larger role. Data: U.S. Census Bureau – Population and Household Estimates
A nuanced picture of migration: population change in the rural and recreation counties
When examining the components of population change across the entirely rural, town/rural mix, and recreational counties, one feature that may leap out is how different the actual number of births and deaths are in each group, yet how similar the trends in birth and death rates are across them all. Figure 10 shows that our entirely rural regions have been dealing with more deaths than births for some time now (note the consistently negative natural change in the first chart), while our town/rural mix and recreational counties have begun to experience this reality more recently. Births, on the other hand, are declining across these county groups as well.
Figure 10: The rising death rate as the population ages is becoming a significant up-hill battle. Data: U.S. Census Bureau, Population and Household Estimates
It’s going to be an uphill battle for the counties in these groups to grow their populations based on natural change, and therefore, in-migration will have to play a larger role if these counties are going to counteract the negative trend. Figure 11 highlights the positive trend in overall migration for rural Minnesota. Even in counties that continue to experience a net out-migration (entirely rural and town/rural mix), the trendline is moving decidedly toward the positive. For recreational counties, positive net migration is currently very strong. It’s also important to note the role international migration plays in our town/rural mix counties. Despite losing nearly 2,000 individuals in 2023, these counties were able to offset that loss with a gain of 1,000 international individuals.
Figure 11: In-migration is improving across rural Minnesota, particularly domestic in-migration. Data: U.S. Census Bureau, Population and Household Estimates
When we combine all of these components, we can see that the upward trend in in-migration is helping offset the worsening natural change across rural Minnesota (Figure 12). Although our entirely rural and town/rural counties continue to experience net out-migration, that out-migration has slowed considerably, making up for at least some of the significant worsening natural change. For our recreational counties, growing in-migration has completely offset the worsening natural change.
Figure 12: Improved migration trends have helped offset worsening natural change. Data: U.S. Census Bureau, Population and Household Estimates
Population trends in Minnesota’s urban counties
So, what do the trends look like for the urban areas of Greater Minnesota? Interestingly, the trends are similar to the rural areas: births are declining while deaths are increasing. The primary difference is that in urban counties, births are still significantly higher than deaths, but that gap is shrinking, too (Figure 13).
Figure 13: Just like in rural counties, births are declining while deaths are increasing. The main difference is that there are still more births than deaths. Data: U.S. Census Bureau, Population and Household Estimates
Natural change in our urban counties has helped prop up the state’s total population, but migration is again where we see the significant changes that have been shaping population change across the state in the last ten or so years. The positive trends in migration for rural areas applies to urban/town/rural mix counties, too, as well as in our suburban and entirely urban counties in Greater Minnesota. However, Hennepin and Ramsey counties have been struggling with migration since 2015. It’s also important to note the continued positive influence that international migration has on total population for all of these county groups (Figure 14).
Figure 14: In-migration trends have bounced back significantly in our urban/town/rural mix and suburban/Greater MN urban counties, but Hennepin and Ramsey have been struggling with their migration trends since the mid-2010s. Data: U.S. Census Bureau, Population and Household Estimates
Putting all these components together, we can see the positive-trending migration numbers offsetting the worsening natural change in Twin Cities suburban and Greater Minnesota urban counties, just like in rural counties. But despite having significantly higher births than deaths, Hennepin and Ramsey counties still have not been able to overcome the negative influence out-migration is having on their total population for at least ten years now (Figure 15).
Figure 15: Migration benefits urban/town/rural mix, suburban, and entirely urban counties in Greater Minnesota. Out-migration is impacting Hennepin and Ramsey’s population negatively. Data: U.S. Census Bureau, Population and Household Estimates
Who’s migrating to rural areas
All of this data explains the reality of population trends going forward. So what can we do? From a policy perspective, there are no policy levers that can influence the largest impacts on population (births and deaths), while the components that policy can impact (migration) haven’t played a large role so far and are only a positive influence in specific regions of Minnesota (recreational, suburbs, urbanized areas of Greater Minnesota).
The question, therefore, becomes: How do we pull the right levers to bolster and improve the components we can influence, i.e., migration? To do so, it’s important to understand first who is moving and why.
The million-dollar question that everyone wants to know in rural Minnesota is: Who is moving here? The answer to this question can help rural promoters figure out where and at whom to target promotional campaigns. This can be a tricky question to answer due to the lack of formal data gathering on migration patterns, but the researchers at the University of Minnesota Extension have spent the last decade gathering information to answer this question. For anyone interested in diving deep into their research, the book Rural Areas in Transition contains the chapter “Rewriting the Rural Narrative,” written by Minnesota researchers Ben Winchester and Ryan Allen, [7] providing information on the who and why of movers to rural Minnesota. The following is a quick summary of that research.
To show the flow of migration, the researchers focused on what age groups tend to move more regularly to specific areas.[8] Essentially, the analysis looks at an age cohort for a specific decennial Census—for example, 20- to 24-year-olds at the time of the 2000 Census. If there were 100 individuals in this age cohort in the 2000 Census and those individuals don’t move, we would expect that there would be 100 individuals in the 30-34 age cohort in the 2010 Census (those individuals being ten years older now). If we see in the 2010 Census that there are 150 individuals age 30-34, that means 50 more people moved into the region than expected, or 50% more than expected. This analysis ignores a lot of obvious issues, such as the assumption that the 100 of 150 people from the 2010 Census represent the same 100 people from 2000. But that isn’t the point. This analysis is meant to look at “flows” of people and where people tend to flow into and out of at specific stages of their life.
Using the same county categories as before, the following charts show the difference between the observed and expected number of individuals from the previous Census at age cohorts ten years older. Figure 16 shows a pretty prominent trend: 20- to 29-year-olds largely flow toward our core metropolitan counties (Hennepin and Ramsey) and counties with colleges located in them, while 30- to 44-year-olds tend to flow to the suburbs and rural counties. As people approach retirement, they continue to flow into recreational counties while all other counties tend to lose this age cohort (55+ year-old movers).
Figure 16: Negative percentages mean people in those age cohorts left those counties over the ten years between 2010 and 2020. Positive percentages mean people moved into those counties over those ten years. Data: U.S. Census Bureau, 2010 & 2020 Decennial Census
It can be easier to see this flow of migration using county-level maps (Figure 17). It clearly shows that counties with four-year colleges receive significantly more 20- to 29-year-olds than would be expected if there were no movement. As people age, the flows begin to spread all around Minnesota as 30- to 44-year-olds along with their 10- to 14-year-old kids spread back out into the rest of the state. As they approach retirement age, people flow toward the Central Lakes counties.
Figure 17: Flows of people by age cohort shows an interesting synergy across Minnesota: college counties attract 20- to 29-year-olds, the rest of the state tends to attract 30- to 49-year-olds, and retirees tend to gravitate toward the Central Lakes region.
Why people move
As the University of Minnesota Extension researchers point out, this isn’t a recent pattern. These flows have stayed relatively the same dating back to the 1970s. Knowing these are longer-term patterns, these flows help us understand that people don’t randomly migrate around the state—they circulate around and in and out of Minnesota at specific points in their lives. Knowing this puts Minnesota at an advantage when it comes to policymaking, because we can now work with these trends, patterns and flows in developing a cohesive resident retention and recruitment strategy that uses all of Minnesota’s assets to engage residents at various points in their lives.
The next question is why people choose these places. It used to be assumed that people largely moved around searching for better employment. From the 1950s through the 1970s, that might have been the case when we had more people than jobs. Now, the answer is more complex.
According to the MN State Demographer, “about 30% of all domestic movers are young people between the ages of 15 and 29 years. The largest net losses of any age occur between ages 18 and 19 years when many young adults move away to attend college.”[9] This is by far the largest group of all movers in Minnesota—as a state we lose more in this age group to other states than we take in. Despite this, we also know that it isn’t the entire state losing these movers—our college counties in Greater Minnesota and Hennepin and Ramsey do particularly well in attracting this age group, just not enough to make up for the individuals moving out.
For older adults, (age 60+), Minnesota again does not perform well. “Minnesota loses older adults on net to warm weather states like Arizona, Florida, and Texas. Wisconsin also sends and receives a large share of Minnesota’s older movers.”[10] However, as we saw in Figure 17, Minnesota’s northern lakes region and other counties with natural amenities perform well with older residents.
In the last group, the “prime working age” adults (30 to 59 years old), the reasons for moving are a little more complicated. There are many reasons why people move at this point in their lives, including new jobs, returning to higher education, and family obligations, just to name a few. Consciously leaning into the positive migration patterns taking place within Minnesota means better understanding people’s reasons for moving.
Table 1, from the University of Minnesota Extension’s “Rural Newcomer Survey” of Greater Minnesota, provides the top ten reasons for why the households they surveyed—some transplants, some returnees—moved to their current location. What’s interesting is that “for a new job” wasn’t as high on the list as might be expected: #3 for transplants (47%) and not even in the top ten for returnees. The factors that rose to the top were related to quality of life: good environment, perceived safety, work-life balance, less congestion, etc. These are qualities that our rural areas and suburbs can easily provide and helps explain the in-migration of this age cohort to these areas.
Table 1: Survey of nearly 1,000 households in Greater Minnesota who moved to their current location within the last 1 to 5 years. Data: University of Minnesota Extension – Allen and Winchester, “Rewriting the Rural Narrative,” 2022.
What all this tells us is that the people who are moving in, out, and around our state aren’t necessarily doing it for employment opportunities, although having Greater Minnesota’s number of job opportunities doesn’t hurt. But there are other major factors at play that Minnesota can take advantage of: a plethora of colleges (four-year and two-year), vibrant core metropolitan areas for young people, suburban and rural areas for those who want something a little quieter in their prime adult and child-raising years, and beautiful counties with high natural amenities for people to age into.
Working Together
The primary takeaway from all this discussion is that we can’t count on positive natural change–more births than deaths–to carry forward Minnesota’s population growth anymore. We’re in the post-Baby Boom world now where we will be competing with every other state in the Frost Belt for workers and families.
That means growth in migration will be more important than ever going forward. Minnesota is fortunate to have organizations that pay attention to population change, identifying where Minnesota does well and not so well with migration. That provides fuel for other organizations working right now on the migration question. That being said, how do we now bring all this information together to help increase Minnesota’s migration? The following are some ideas to help guide our next steps.
Commit to Minnesota, not just your region
We need to accept that we all have a role to play in keeping people in Minnesota, not just our regions. Being resentful about other regions of the state “poaching our people” should no longer hold back our efforts. This means that rural areas that don’t have a college will have to accept that they may lose their 18-year-olds to college towns and metropolitan areas. Instead, let’s work to keep them in Minnesota. For core urban counties, seeing suburban and rural areas promote themselves to potential movers looking for a quieter lifestyle may be hard, but we would rather have people live in those places in Minnesota than find quieter spaces in another state. We all have to be committed to Minnesota, not only our regions.
Retaining college-age movers
Minnesota has an embarrassment of riches when it comes to available, quality higher education. Our two- and four-year institution mix provides ample opportunity for young people to learn, grow and pursue their desired careers here in Minnesota. That’s why it’s disappointing to read this in the report from the Minnesota State Demographic Center: “While a fair share of college students return to Minnesota after completing their degree in another state, the net losses are not fully countered in the older age groups.”[11]
It’s likely that the fastest flow of young people may be those rural high school graduates living along the borders of Minnesota, flowing right on into universities just over the state line. In our report, “The Journey to meaningful workforce participation among graduates in Southwest Minnesota,” we found that over 25% of Minnesota’s high school graduates were graduating with degrees from colleges in other states.
The North Star Promise scholarship program is an excellent start in attempting to retain these young people in Minnesota, but let’s continue to build on this program by exploring other ways we can attract young people to our colleges and universities and retain them after graduation. Staff at the Office of Higher Education and within our higher education institutions are highly motivated to turn around the current trends.
Retaining and attracting prime working-age movers
The suburbs and Greater Minnesota are assets in retaining and attracting prime working-age movers. Over the last five years, a number of initiatives have popped up across Greater Minnesota that lean into this trend by promoting their regions as great places with a quiet lifestyle and access to the outdoors. Finding ways to support and provide resources for these initiatives can help bolster this trend among prime working-age movers across Minnesota. A great example of this work is Otter Tail County, where they have invested in a position titled The Rural Rebound Coordinator. Supporting ways to spread these initiatives around Greater Minnesota can help more communities take advantage of migration trends among prime working-age movers.
In addition, historically high job vacancy rates have made employers more motivated than ever to implement strategies to bring workforce into our rural regions. Many public-private partnerships are being developed across Greater Minnesota to help in recruiting new workforce and retaining current residents, exploring options on how these partnerships can continue to grow and reduce any policy barriers prohibiting the expansion of these efforts.
Attracting retirees
With Minnesota’s cold climate, keeping retirees has been a challenge. However, the research shows that counties with high natural amenities are great at attracting these households. And except for Wisconsin, Greater Minnesota has the highest number of counties with natural amenities compared to bordering states. Finding ways to promote these regions to people in other states as great places to retire and following that up with services to help retirees age in place could help us close the gap in the net out-migration currently experienced by this age cohort.
Population trends are a complex issue, and boosting and improving our current trends will require investment and maybe even some trial and error. The declining migration across the country[12] means ever growing competition for us, so the return on investment may not be high. But if Minnesota wants to solve its workforce shortage issues now and into the future, investing in a cohesive migration strategy that uses the entire state may just be the most effective option.
References
Allen, Ryan, and Ben Winchester. “Rewriting the Rural Narrative.” In Rural Areas in Transition, by Norman Walzer and Christopher Merrett, 171–92, 1st ed. New York: Routledge, 2022. https://doi.org/10.4324/9781003280620-9.
“An Analysis of Migration Trends and Patterns in Minnesota.” State of Minnesota: Minnesota State Demographic Center, April 2024. https://mn.gov/admin/assets/Migration%20Report_FINAL_tcm36-620018.pdf.
Nord, Mark, and John Cromartie. “Migration: The Increasing Importance of Rural.” Choices, Graphically Speaking, 12, no. 3 (1997): 2. https://doi.org/10.22004/ag.econ.131604.
Appendix A
[1] “An Analysis of Migration Trends and Patterns in Minnesota.”
[2] “An Analysis of Migration Trends and Patterns in Minnesota.”
[3] https://extension.umn.edu/economic-development/rural-brain-gain-migration
[4] https://mn.gov/admin/demography/
[5] Allen and Winchester, “Rewriting the Rural Narrative,” 2022, 171.
[6] Nord, Mark, and John Cromartie. “Migration: The Increasing Importance of Rural.” Choices, Graphically Speaking, 12, no. 3 (1997): 2. https://doi.org/10.22004/ag.econ.131604.
https://www.ers.usda.gov/data-products/county-typology-codes
[7] Allen and Winchester, “Rewriting the Rural Narrative,” 2022.
[8] https://extension.umn.edu/economic-development/rural-brain-gain-migration
[9] “An Analysis of Migration Trends and Patterns in Minnesota,” 2.
[10] “An Analysis of Migration Trends and Patterns in Minnesota,” 2.
[11] “An Analysis of Migration Trends and Patterns in Minnesota.
[12] “An Analysis of Migration Trends and Patterns in Minnesota.”